11

I have previously been told that a sign that some application has a memory leak is that kernel_task has a large memory footprint, commonly on the order of gigabytes. If an awry kext was causing this memory usage, we would expect to see a discrepancy between the allocated memory and those expected to be allocated, i.e.

diff <(kextstat|tr -s ' ' | cut -d ' ' -f 5) <(kextstat| tr -s ' ' | cut -d ' ' -f 6) 

would return something other than the words 'Wired' and 'Name'.

Whilst writing my thesis, I have noticed that changing a pdf whilst it is open in Preview often causes bad things to happen: occasionally, the memory usage of kernel_task can grow to around eight gigabytes, or more. If I kill preview, it returns to normal, instantly. So, obviously something is wrong -- and Preview is leaking memory under these conditions.

So, my question is this: if I know that a process has leaked ram via a sudden and unexpected increase in the footprint of kernel_task, why can't OS X know that something has gone wrong. If killing Preview restores my missing malloc()'d memory, why doesn't Darwin do garbage collection automagically for me?

Do I have a fundamental misunderstanding of how memory management works?

EDIT: (15/9/15)

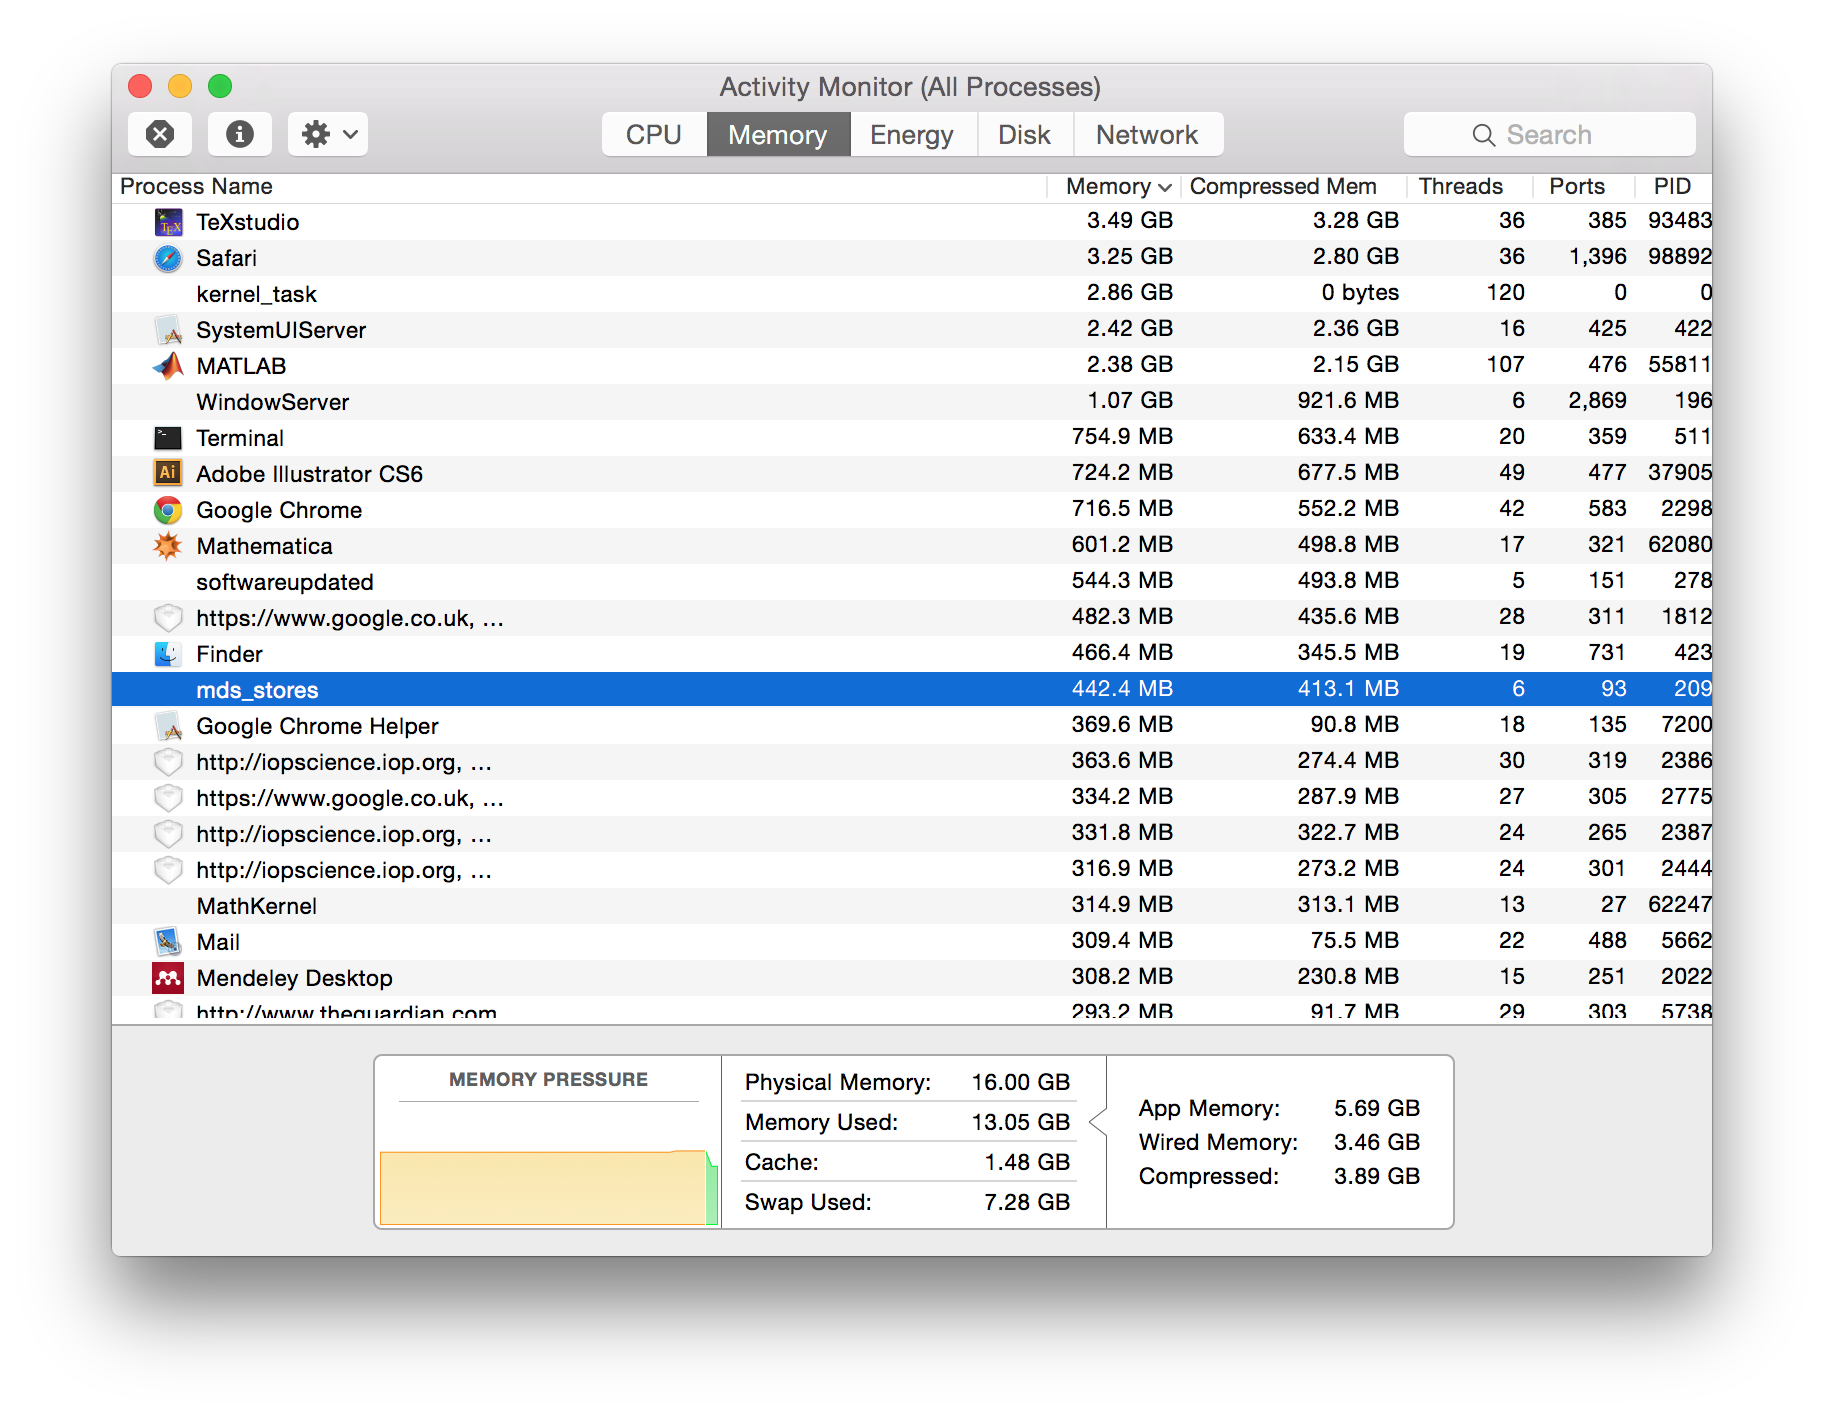
Here's a demonstration of what I'm talking about. First of all, I notice high memory usage by kernel_task (note Preview is open, just visible at the bottom of Activity Monitor, using 333 MiB of ram):

High kernel memory usage

Following the helpful remarks by Ashley below, let's find out how much each kext is using:

$ kextstat | awk 'NR==1{ printf "%10s %s\n", $5, $6; } NR!=1{ printf "%10d %s\n", $5, $6; }' | sort -n

...
...
...
   1249280 com.apple.driver.DspFuncLib
   1769472 com.apple.nvidia.driver.NVDAGK100Hal
   2629632 com.apple.nvidia.driver.NVDAResman
   6184960 com.apple.driver.AirPort.Brcm4360
$

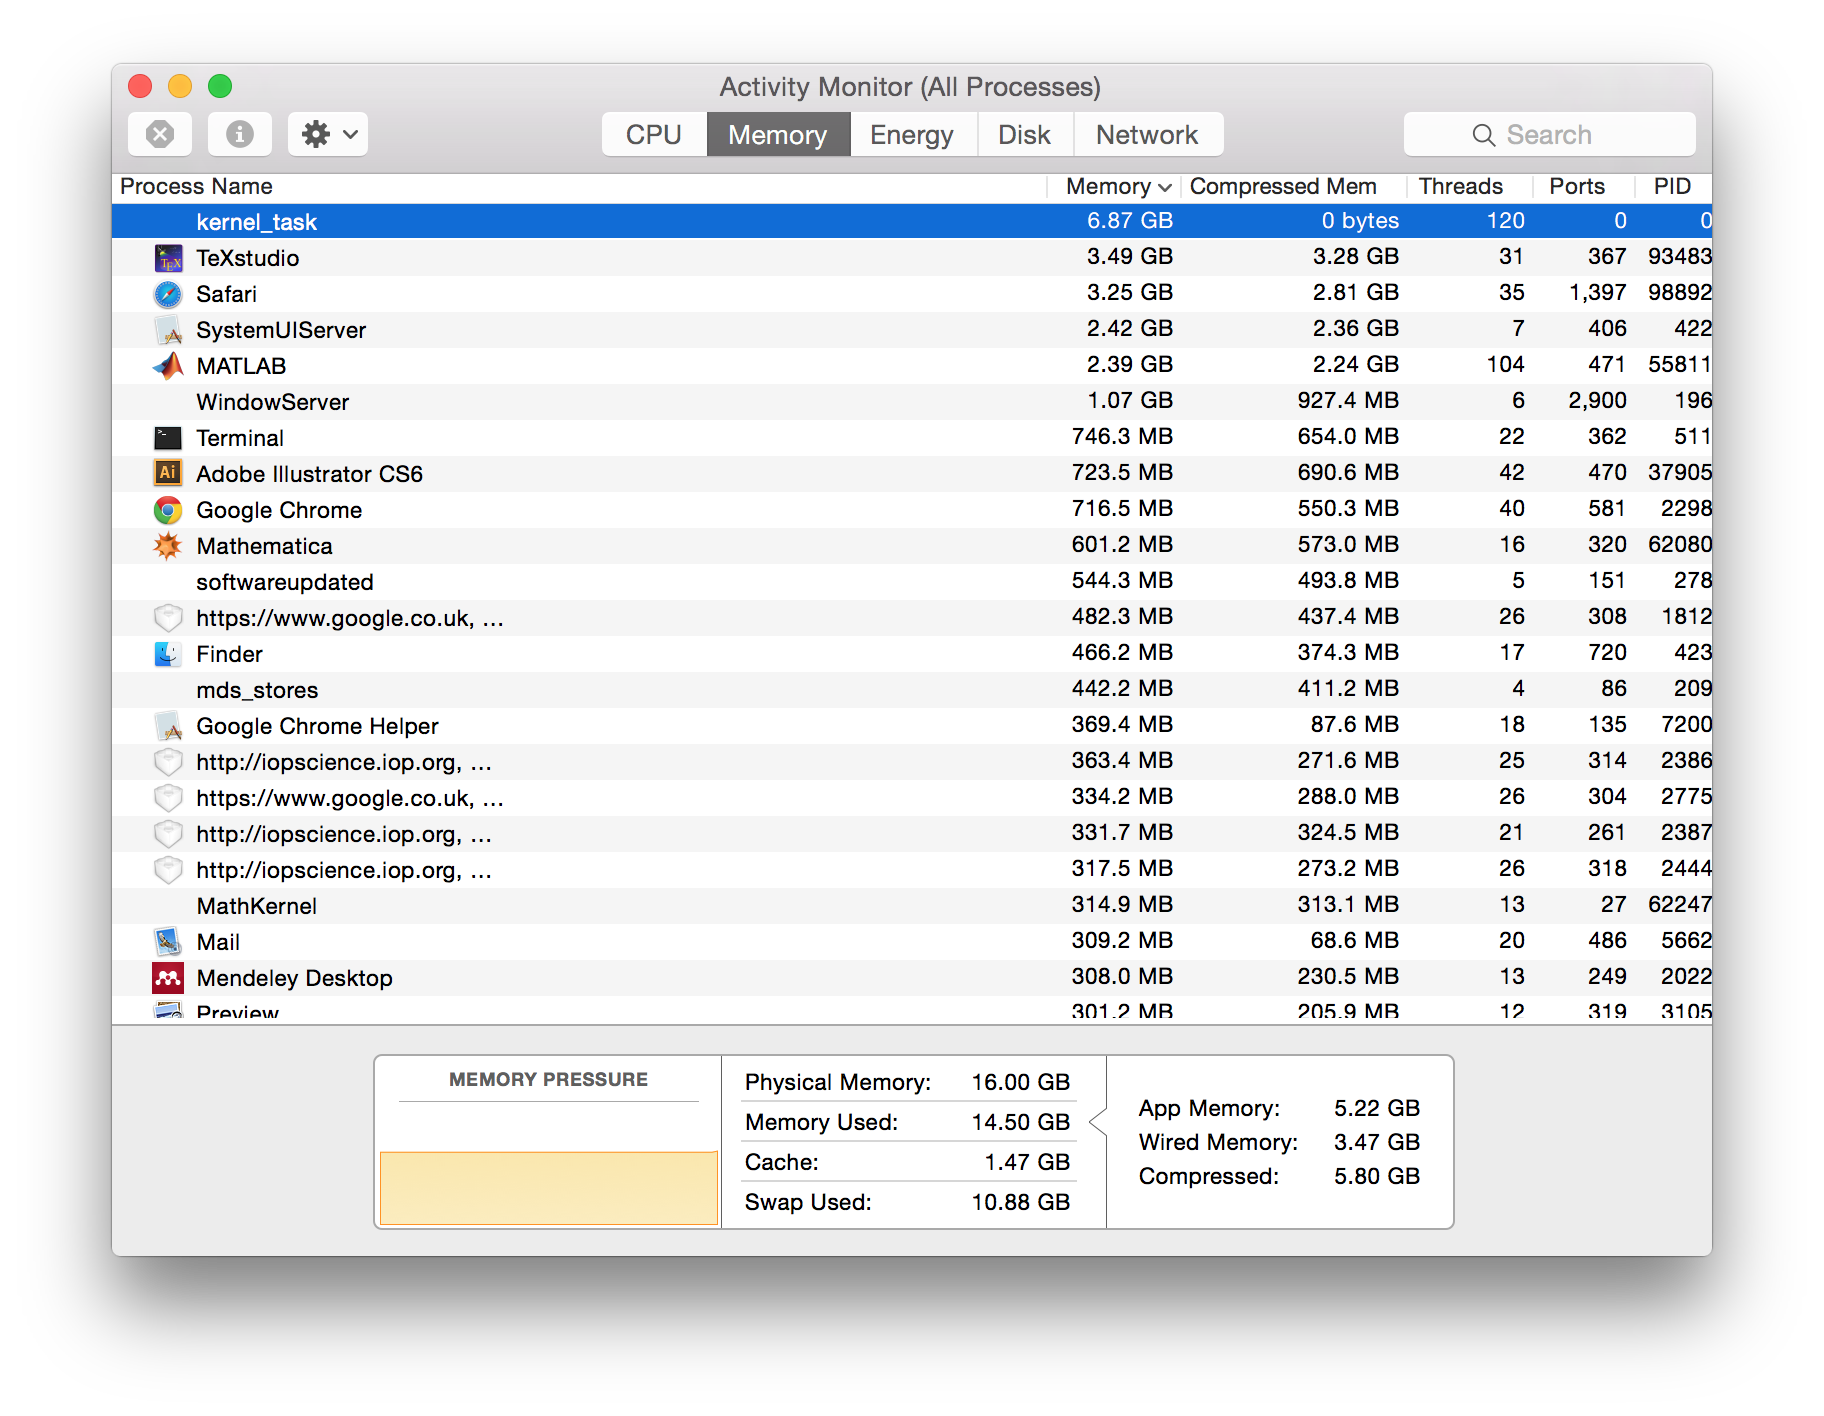
So, not a huge amount. My machine has both discrete and integrated GPUs; their drivers are only using a few MiB of wired ram. On my hunch, let's kill Preview, and look what happens to the memory footprint of kernel_task:

Killing preview helps things

Preview's gone, and the memory footprint of the kernel has gone down dramatically. There's still no evidence of a change in kext usage: the output of the above command is unchanged.

Edit: Bug reported as No. 22701036. I am still waiting for a response from apple. There's nothing particularly interesting if you inspect the process in ActivityMonitor, but maybe I'm missing something.

4
  • I'm confused about two things -- could you clarify? 1) I think your diff command is comparing the Size and Wired columns from the kextstat output. I agree that Size is "allocated memory", but I don't think Wired is "expected to be allocated" (man kextstat describes it as "The number of wired bytes of kernel memory that the kext occupies"). 2) Are you seeing the discrepancy between Size and Wired when you have the issue with Preview?
    – Ashley
    Commented Sep 15, 2015 at 9:13
  • 1) You're right -- I am comparing the elements in Size and Wired from kextstat. My understanding is that if a kext is leaking, then the allocated bytes and those that the kernel knows are allocated will be different. In this case, I've put that there to show that I don't have a leaking kext -- so, 2) this doesn't occur when Preview eats ram. Instead, kernel_task grows a lot. I'll try and recreate this issue and take a picture :-).
    – Landak
    Commented Sep 15, 2015 at 9:42
  • Thanks! Hold on a sec: I'm just writing an answer that might help.
    – Ashley
    Commented Sep 15, 2015 at 9:43
  • Any resolution to this problem?
    – Alex
    Commented Dec 28, 2023 at 13:08

2 Answers 2

6
+50

The core of OS X is not garbage collected; IOKit's libkern C++ Runtime requires developers to manage their own memory.

Mac Memory Management

From How does memory management work in Mac OS X?

Apple documents the lowest levels of the Mach Kernel and the virtual memory subsystem fairly well on the web as part of it's developer documentation.

Since that kernel was developed by Carnegie Mellon University, you can find dozens of papers describing it quite easily.

Other Sources

Garbage Collection

Garbage collection exists at the user or application layer. Even at this layer, garbage collection only helps if the application has released all claims to the memory. A circular dependancy can defeat garbage collection. Garbage collection itself is an evolving area of research and difficult to get right.

Report Bugs and Memory Leaks

Bugs within OS X will be leaking memory. Given the size of the code base, this is almost certain.

Please report reproducible bugs directly to Apple. Every bug report helps and maybe your example will be the one that helps Apple's engineers pin down the cause.

2
  • This is disappointing, but undoubtedly correct. I've reported the bug to Apple -- I just find it annoying!
    – Landak
    Commented Sep 18, 2015 at 19:15
  • 2
    Please can you share the bug number as an edit to your question. Others finding your question helpful can then file duplicate bugs noting your original. A pile of related bugs will help justify more engineering time. Commented Sep 19, 2015 at 8:19
4

Here's my guess, assuming your Mac has an integrated GPU (eg Intel Iris Graphics).

When you have your thesis open in Preview, graphics card memory is used to hold the image ("texture") of the Preview window, and perhaps also some off-screen-but-decoded pages from the thesis.

With an integrated graphics card, the video memory is actually (partially?) located in system RAM, which is shared between the CPU and GPU. On some integrated graphics cards, the amount of system RAM used is dynamically allocated (see Apple HT204349).

I'd guess that you are intermittently seeing a bug in the graphics card driver and/or Preview, which isn't releasing system memory correctly when Preview reloads your thesis PDF. (However this bug is mitigated by OS X / the driver correctly releasing the memory when Preview quits.)

You could try looking at the output of kextstat and see if the numbers in the Size column increase when you experience the issue. My theory is that the 8GB increase you mention will be due to the graphics card driver.

The following command (from a comment on this related and interesting answer) sorts the output of kextstat to make it easier to see which kext is using the most memory (although note this sorts by the Wired column... there's a similar, simpler incantation in this answer with an explanation if you'd like to tweak this).

kextstat | awk 'NR==1{ printf "%10s %s\n", $5, $6; } NR!=1{ printf "%10d %s\n", $5, $6; }' | sort -n
1
  • Good guess -- and thank you hugely for a useful, sorted output of kextstat. However, it still doesn't look like that's what is actually going on: during the Preview-gobbling, the memory footprint of com.apple.nvidia.driver.* was unchanged. I've edited my question to reflect this.
    – Landak
    Commented Sep 15, 2015 at 12:22

You must log in to answer this question.

Not the answer you're looking for? Browse other questions tagged .