147

I was using my MacBook Pro (with 16GB of RAM) as usual and out of blue I've this popup that:

Your system has run out of application memory.

To avoid problems with your computer, quit any applications you are not using.
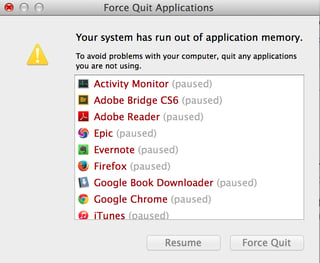
Force Quit Applications - Your system has run out of application memory - screenshot

I've obviously closed few which I could, but it didn't help.

After checking on memory, it seems kernel task ate 7GB and 22.36GB swap memory was used of total 23GB (which obviously was the case). However I've still 20GB of space free on my SDD.
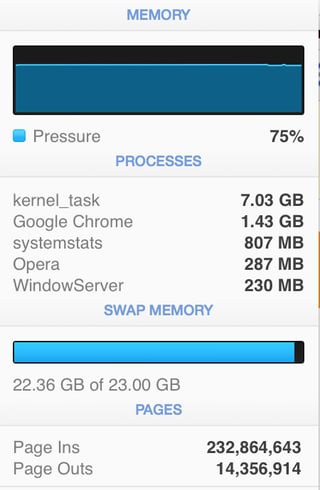
Memory - iStat Menus - screenshot

Activity Monitor didn't help much whilst my OS X was heading to the destruction.
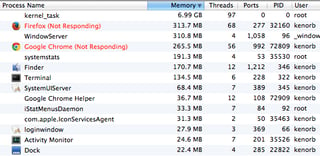
Process Explorer

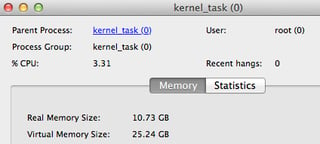
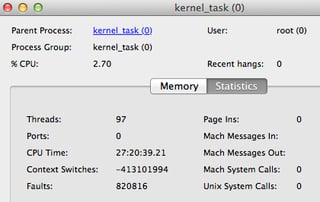
kernel_task - Memory tab - screenshot kernel_task - Statistics tab - screenshot

My top stats before my kernel freeze:

Processes: 344 total, 2 running, 5 stuck, 337 sleeping, 2580 threads                                                                                                                         19:23:56
Load Avg: 1.56, 1.62, 2.09  CPU usage: 3.51% user, 8.47% sys, 88.1% idle   SharedLibs: 46M resident, 0B data, 6572K linkedit. MemRegions: 757970 total, 2139M resident, 56M private, 907M shared.
PhysMem: 9410M used (6198M wired), 556M unused. VM: 1155G vsize, 1311M framework vsize, 112872658(320) swapins, 122668389(0) swapouts. Networks: packets: 299419263/363G in, 142126838/14G out.
Disks: 58970173/1079G read, 20012389/1120G written.

At the end my OS X frozen and I had to do hard reset, repair my SDD in recovery mode and fixing afterwards (recovering lost work, fixing application conflicts, checking my lost+found folder, Chrome/Terminal tabs gone, headache, etc.).

My question is, how do I check on high memory usage of kernel task or how to properly deal with that kind of situation? I've tried to take Sample with Activity Monitor, but it's greyed out.


My MacBook Pro details: 2.3GHz Intel Core i7 (late 2013) with 16GB RAM. OS X: 10.9.5

9
  • 1
    @klanomath Usually I've plenty of freezes especially with long uptime and these are just kernel freezes for unknown reason (my MBR is quite new). But this is the first I've seen that popup that I'm out-of-memory (with 16GB RAM and 50GB of free space). However my main question is how to I investigate memory usage of kernel task, so if it's reproducible shouldn't be relevant.
    – kenorb
    Commented Mar 25, 2015 at 20:46
  • 9
    Use zprint -t (Lion) or sudo zprint -t (Mountain Lion and later).
    – klanomath
    Commented Mar 25, 2015 at 20:53
  • 1
    You are right with the irrelevance of the reproducibility regarding your question in the title, but it might be relevant solving your problem(s).
    – klanomath
    Commented Mar 25, 2015 at 20:58
  • 1
    Would you mind adding the output to your question (or save it to your documents)? Just for future reference/to be able to compare it to a zprint made in a more critical system state. IMHO it's a bad luck leak. If you post it I may be able to tell you more.
    – klanomath
    Commented Mar 25, 2015 at 21:08
  • 1
    I have the same issue all of the sudden. I'm pretty sure its related to docker for mac or hyperkit. As soon as I stop docker for mac, kernal_task starts eating 10GB+ of memory Commented Jan 21, 2018 at 19:54

2 Answers 2

204

There are many things that go wrong with high kernel task usage. Usually this is related to faulty or heavy process which overusing system resources (such as indexing storage, running VMs, too many tabs in the web browser or some other background processes).

Here are some methods which help to investigate OS X kernel usage issues:

Basic methods

  • Run Console.app and check on 'All Messages' to see if anything unusual currently is happening.
  • Use Activity Monitor to read system memory and determine how much CPU, RAM and Disk is being used.

    Alternatively run top in Terminal and hold Space to refresh - easier to find the cause problem (swapins/swapouts/disks?).

  • Run sudo fs_usage in Terminal to report system calls and page faults related to filesystem activity in real-time (I think this is the best option from all other). Then hit Control-C to stop it.

    Action: Consider killing apps which appears frequently on the list, but you're not using them.

    Learn more at: How do I debug an out-of-control “kernel_task” process?

  • Run sudo syscallbypid.d (or syscallbyproc.d), wait a bit, hit Control-C. Now check which process generated the most system calls in that given time (last column) and if you recognise it, consider kill it. If not, Google it and learn more about it.

Advanced methods

  • Use sysdiagnose command (can be triggered by hitting Shift-Control---. (period) to quickly gather system-wide diagnostic information helpful in investigating system memory/performance issues (will appear in /var/tmp) either by you or Apple guys. During analysis, try to not do anything, when done - consider uncompressing the generated file and analyse the logs.

    See: How do you get system diagnostic files from OS X?

  • Run footprint to gather detailed memory information on a per-VM-region type level and swapped bytes:

    sudo footprint -a
    

    Older version:

    sudo footprint -all -categories -swapped -collapseSharing
    
  • Use spindump to profile entire system, it'll generate /tmp/spindump.txt file (including kernel and its extensions).

  • Use vm_stat to show virtual memory statistics. E.g.

    vm_stat 1 # to display every second.
    
  • Use zprint to check information about kernel usage, it's possible by:

    sudo zprint -t -s | head -n20
    

    It'll show the most wasting kernel zones.

  • Use newproc.d to snoop new processes as they are executed, creatbyproc.d for files:

    sudo newproc.d
    sudo creatbyproc.d
    

    Note: On newer OS X (10.11 or above) this may not work when integrity protection is enabled (check by csrutil status).

  • Try sar - system activity reporter which can sample and report various cumulative statistic counters maintained by the operating system.

For more useful debugging tools, check for dtrace scripts (grep dtrace /usr/bin/*). If you know the faulty process which causing the problem, you may use dtruss to debug it.


Actions

Here are some suggestions which can help you with the operating system issues.

  • Free up some inactive memory. In order to do this, you've to flush cache first and force disk cache to be purged:

    sync && sudo purge
    

    sync - force completion of pending disk writes (flush cache)

    purge - force disk cache to be purged (flushed and emptied)

    Its function is basically to terminate all the I/O pending operations which are using disk cache and then to free all the occupied disk cache, so it should free disk space to ease paging out and swapping out of main memory. It is safe to use, as it does not affect anonymous memory that has been allocated through malloc, vm_allocate, etc.

  • Use some 3rd party apps to clear up some overused memory such as iBoostUp, SystemPal, etc.

  • You may also disable temporary Spotlight:

    sudo launchctl unload -w /System/Library/LaunchDaemons/com.apple.metadata.mds.plist 
    

    And consider other services by:

    sudo launchctl list | grep ^[0-9]
    sudo launchctl bslist | grep ^A
    
  • Quit your web browser and check if that helps. For example using Chrome is very resourceful, especially when there is some front-end processing going on in the background (e.g. Javascript) or advert-like animations are constantly rendering the content.

5
  • 1
    Spotlight keeps reapparing, but I'm not using it, and every time I kill it it reappears the second after... How/should I do I get rid of it?
    – ling
    Commented Oct 24, 2016 at 12:25
  • 1
    @ling I would suggest you to ask another question then, since this is related to high kernel task memory, not a Spotlight specific.
    – kenorb
    Commented Oct 24, 2016 at 12:27
  • 2
    sigh I've got 4 GB ram on my mac, and just recently the kernel task was going upwards to 3.1 GB, basically freezing my whole computer. Closed my Google Drive tab, and it went down to 950 MB...
    – Zizouz212
    Commented Dec 20, 2016 at 2:07
  • 4
    Not specific enough to actually solve the high kernel_task memory & cpu usage issue.
    – hyiltiz
    Commented Apr 25, 2017 at 1:19
  • What I want to know is what is it that causes Safari or Firefox tags to end up adding such overhead to kernel_task. What is it that means browser activity ends up in kernel_task? Commented Aug 23, 2022 at 15:11
6

I had a very similar issue after replacing my LCD screen on a late 2012 iMac. Fan was running at high RPM and had high CPU Kernel_task usage. I narrowed it down to a Temperature sensor you must move from the old LCD screen to the new replacement screen. if you forget to do so the CPU speed and Kernel_task are affected slowing down your system.

2
  • 2
    Reason for downvoting: This is unrelated to the OP question about memory usage and not about cpu usage (although you are right about kernel_task's CPU usage being used to prevent the CPU from being used by application and thus, cool the laptop)
    – xryl669
    Commented Apr 15, 2020 at 10:07
  • I am using 2 extend monitors and got this issue. This is the step i did and resolved it. developer.apple.com/forums/thread/17263
    – Binh Ho
    Commented Jul 18, 2021 at 2:18

You must log in to answer this question.

Not the answer you're looking for? Browse other questions tagged .