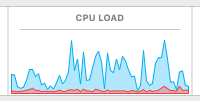
Lately my MacBook Pro has a lot of moments where it slows down for a few seconds, stops responding to keys and touchpad, displays a rainbow wheel of doom, and then comes back. If I go to the Activity Monitor program, I see something like this:
The CPU was just getting loaded by something, but now it's not there, so I can't see what it was. It's hard to get to the Activity Monitor quickly when it's happening, because the entire system is slow and unresponsive.
I wish there were a way to click on those blue peaks and see the CPU usage data at that point in time. Anyone know a way to do something like that? In other words, a way to find out: "What was bogging my computer down 10 seconds ago?"


