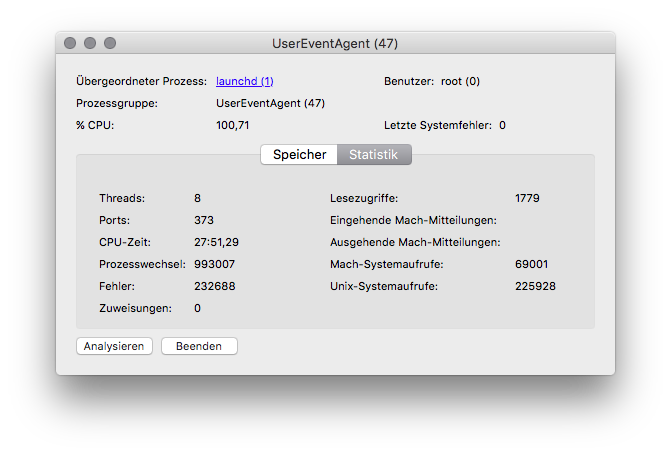
Since about a month, my MBPr sometimes starts up it’s fans and is getting really hot. The activity monitor tells me, that this is because of the UserEventAgent, which runs with 100% CPU usage.
This spike can last for about 10 to 30 minutes and then everything goes back to normal. There seems to be no reason behind it. There is no pattern, when it starts and nothing I can do, to stop it. The same pattern still applies when I don’t do anything and just wait. It still takes a serious amount of time, until UserEventAgent goes back to normal.
I also checked the log to find out, if there are any messages, that could give me a hint, but the messages differ every time. There is no message that always causes the UserEventAgent to start up the fans and there is none to stop it.
The only thing I noticed is a huge number of errors, logged in the UserEventAgent statistics:
Is there any way to find out, what causes the UserEventAgent to go haywire? Maybe a terminal command, or something like that?
As a note: Testing it will take some time, because I will have to wait for the next spike to test solutions.
Update January 2nd, 2015
I just got a new spike.
02.01.16 12:18:14,403 UserEventAgent[47]: Failed to send message because the port couldn't be created.
02.01.16 12:18:14,404 UserEventAgent[347]: com.apple.TMHelperAgent.SetupOffer enabled
02.01.16 12:18:17,234 UserEventAgent[47]: Failed to send message because the port couldn't be created.
02.01.16 12:18:17,235 UserEventAgent[347]: com.apple.TMHelperAgent.SetupOffer enabled
02.01.16 12:19:26,417 UserEventAgent[47]: Captive: [UserAgentDied:143] User Agent @port=101939 Died
02.01.16 12:19:26,422 com.apple.xpc.launchd[1]: (com.apple.UserEventAgent-Aqua[347]) Service exited due to signal: Killed: 9
02.01.16 12:19:26,681 UserEventAgent[16347]: Failed to copy info dictionary for bundle /System/Library/UserEventPlugins/alfUIplugin.plugin
02.01.16 12:20:27,224 UserEventAgent[45]: Failed to copy info dictionary for bundle /System/Library/UserEventPlugins/alfUIplugin.plugin
02.01.16 12:20:27,227 UserEventAgent[45]: Captive: CNPluginHandler en0: Inactive
02.01.16 12:20:27,794 UserEventAgent[45]: Received XPC_ERROR_CONNECTION_INVALID for connection com.apple.backupd.xpc
02.01.16 12:20:27,799 UserEventAgent[45]: Failed to send message because the port couldn't be created.
02.01.16 12:20:28,000 UserEventAgent[45]: nsurlsessiond_events plugin: adding token 1 for client softwareupdate_download_service
02.01.16 12:20:30,795 UserEventAgent[45]: Captive: [CNInfoNetworkActive:1748] en0: SSID 'Boop' making interface primary (protected network)
02.01.16 12:20:30,795 UserEventAgent[45]: Captive: CNPluginHandler en0: Evaluating
02.01.16 12:20:30,797 UserEventAgent[45]: Captive: en0: Probing 'Boop'
02.01.16 12:20:30,897 UserEventAgent[45]: Captive: CNPluginHandler en0: Authenticated
02.01.16 12:20:30,921 com.apple.xpc.launchd[1]: (com.apple.UserEventAgent-LoginWindow) This service is defined to be constantly running and is inherently inefficient.
02.01.16 12:20:31,047 UserEventAgent[217]: Failed to copy info dictionary for bundle /System/Library/UserEventPlugins/alfUIplugin.plugin
02.01.16 12:20:31,072 UserEventAgent[217]: user agent networkd: built Nov  3 2015 13:38:22
02.01.16 12:20:34,359 UserEventAgent[45]: assertion failed: 15C50: com.apple.fsevents.matching + 4704 [80662126-A833-3279-8A32-49393FD4E964]: 0x0
02.01.16 12:20:44,822 com.apple.xpc.launchd[1]: (com.apple.UserEventAgent-Aqua) This service is defined to be constantly running and is inherently inefficient.
02.01.16 12:20:45,031 UserEventAgent[269]: Failed to copy info dictionary for bundle /System/Library/UserEventPlugins/alfUIplugin.plugin
02.01.16 12:20:45,064 UserEventAgent[269]: com.apple.TMHelperAgent.SetupOffer enabled
02.01.16 12:20:45,167 UserEventAgent[269]: user agent networkd: built Nov  3 2015 13:38:22
02.01.16 12:20:45,453 UserEventAgent[269]: received an unknown event from daemon
02.01.16 12:22:12,000 kernel[0]: process UserEventAgent[45] thread 1395 caught burning CPU! It used more than 50% CPU (Actual recent usage: 86%) over 180 seconds. thread lifetime cpu usage 90.014261 seconds, (88.775576 user, 1.238685 system) ledger info: balance: 90002688195 credit: 90002688195 debit: 0 limit: 90000000000 (50%) period: 180000000000 time since last refill (ns): 104457330065
02.01.16 12:22:20,007 spindump[442]: Saved cpu_resource.diag report for UserEventAgent version ??? (???) to /Library/Logs/DiagnosticReports/UserEventAgent_2016-01-02-122220_Hennings-MacBook-Pro.cpu_resource.diag
If you want to take a look at the report, you can find it here: https://gist.github.com/hpohlmeyer/da3a91c66061c8572ebe
There is no additional message when the process returns to its normal CPU load, but anyone of you knows what to look for in the logs?!
Update January 23rd, 2015
Lately the process won’t go back to normal after some time. I have to restart my mac in order to bring back a normal cpu usage of the UserEventAgent. I tried to close all running apps, but that does not seem to have any effect at all.
My guess is, that it might be a driver related problem, but I have no clue how to track it down. Is there any way to do that?
Ok, currently even a restart does not help. Battery is dead in an instant and fans are constantly running at full speed. I am so annoyed!


