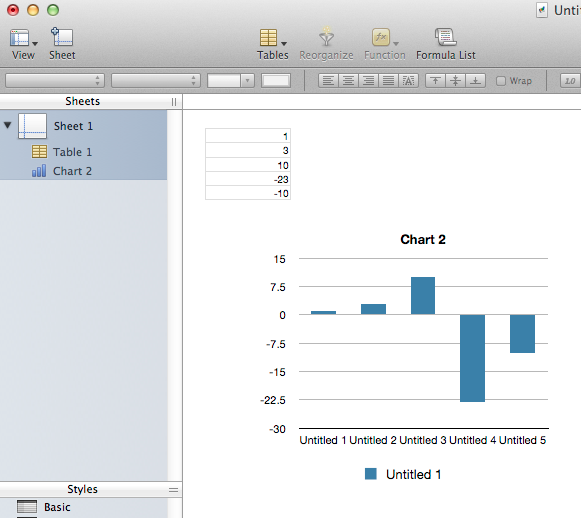
I am using Numbers '09 v2.1 (436) and I have a table having positive and some negative values. When in my project I add a column chart mapping properly data from that table it displays a chart without negative values. That is, "negative columns" aren't displayed in the chart, only "positive columns" are.
How can I display those negative values? Is it possible?

