I'm seeing a common Mac OS Catalina (10.15.6) fault with accountsd/deleted and Siri? (com.apple.siri.e)? It seems to be extremely serious! Does anyone know the cause or solution for this? My computer seems to be overheating a lot and has very very high CPU usage!? Is this because of overheating or something else with Siri and a demon?
OS Version: Mac OS X 10.15.6 (Build 19G73)
Is this a possible "malware" or virus? Or some bug with SQLITE?
ACCOUNTS DAEMON (AccountsDaemon):
FAULT MESSAGES:
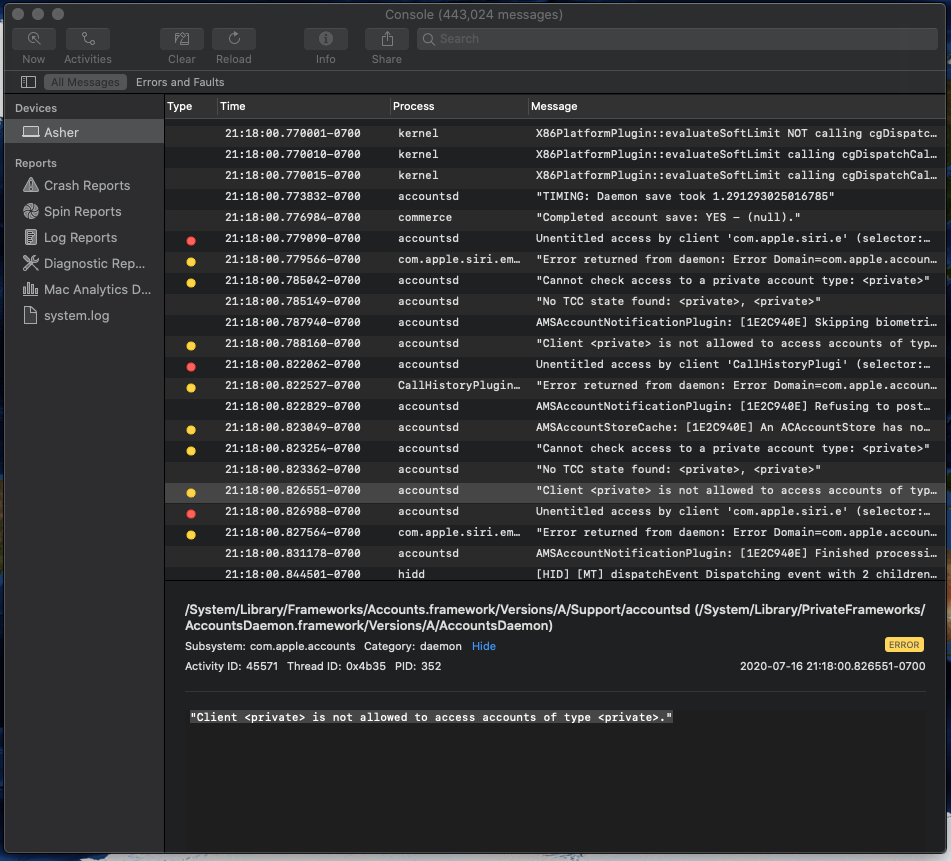
"TIMING: Daemon save took 1.291293025016785"
"Completed account save: YES - (null)."
Unentitled access by client 'com.apple.siri.e'
(selector: accountsWithAccountType:handler:)
"Error returned from daemon: Error Domain=com.apple.accounts Code=9"
"Cannot check access to a private account type: <private>"
"No TCC state found: <private>, <private>"
AMSAccountNotificationPlugin: [1E2C940E] Skipping biometrics update (not authed)
"Client <private> is not allowed to access accounts of type <private>."
Unentitled access by client 'CallHistoryPlugi' (selector: accountsWithAccountType:handler:)
"Error returned from daemon: Error Domain=com.apple.accounts Code=9"
AMSAccountNotificationPlugin: [1E2C940E] Refusing to post a com.apple.itunesstored.accountschanged notification because nothing on the account actually changed.
AMSAccountStoreCache: [1E2C940E] An ACAccountStore has no associated media type. Returning the default media type for the current process. accountStore = AMSAccountStoreCache | defaultMediaType = com.apple.AppleMediaServices.accountmediatype.itunes
"Cannot check access to a private account type: <private>"
"No TCC state found: <private>, <private>"
"Client <private> is not allowed to access accounts of type <private>."
Hardware Overview:
  Model Name:   MacBook Pro
  Model Identifier: MacBookPro11,3
  Processor Name:   Quad-Core Intel Core i7
  Processor Speed:  2.8 GHz
  Number of Processors: 1
  Total Number of Cores:    4
  L2 Cache (per Core):  256 KB
  L3 Cache: 6 MB
  Hyper-Threading Technology:   Enabled
  Memory:   16 GB
  Boot ROM Version: 162.0.0.0.0
  SMC Version (system): 2.19f12
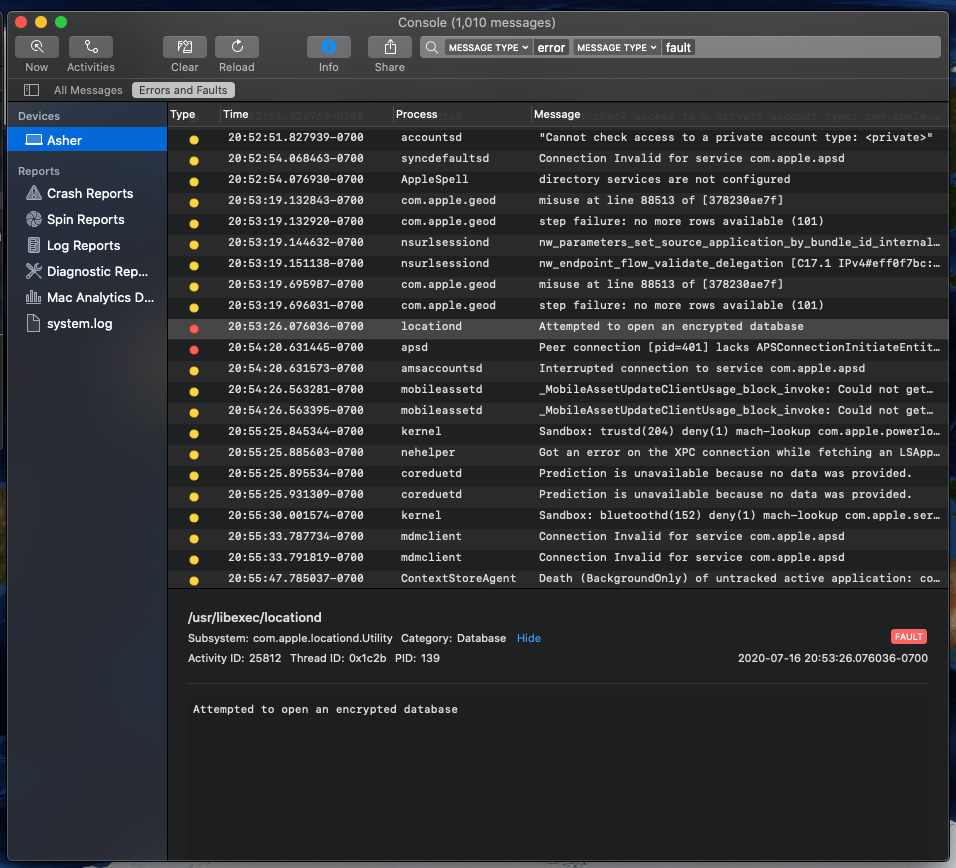
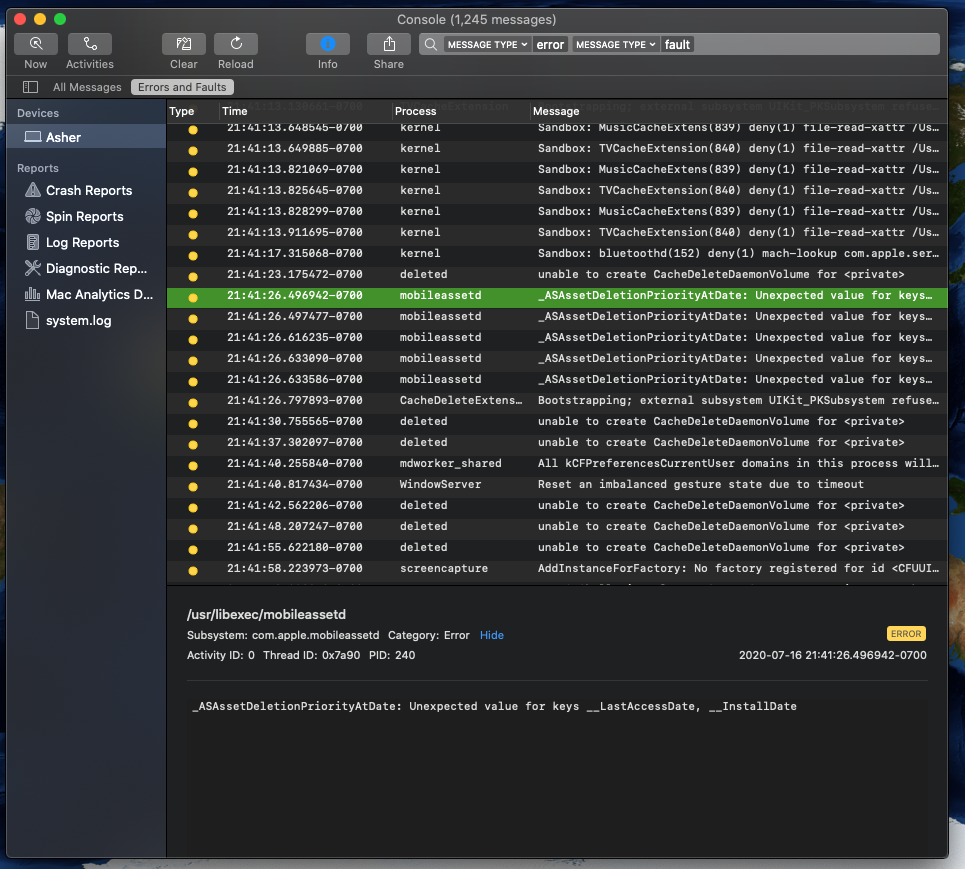
SCREEN SHOT: System Console "OS" FAULT MESSAGE:
What suggestions do people have about this problem?
Thanks! Asher :)
Here is a memory profile... from the command "kextstat -l -k | awk '{n = sprintf("%d", $4); print n, $6}' | sort -n"
901120 com.apple.kec.corecrypto
999424 com.apple.iokit.IOThunderboltFamily
1024000 com.apple.iokit.IOUSBHostFamily
1036288 com.apple.iokit.IOBluetoothFamily
1212416 com.apple.filesystems.apfs
1294336 com.apple.driver.DspFuncLib
1425408 com.apple.iokit.IO80211Family
1470464 com.apple.driver.AppleIntelFramebufferAzul
1753088 com.apple.nvidia.driver.NVDAGK100Hal
2981888 com.apple.nvidia.driver.NVDAResman
8196096 com.apple.driver.AirPort.BrcmNIC
here is a "top" command output...
PID  COMMAND      %CPU TIME     #TH   #WQ  #PORT MEM    PURG   CMPR PGRP PPID

458  deleted      70.9 17:27.80 8/1   7/1  79    4596K  0B     0B   458  1
570  Console      51.2 23:14.11 15    11   1243- 382M-  6460K  0B   570  1
573  diagnosticd  28.5 21:18.62 8     7    529   10M    0B     0B   573  1
303  sysmond      22.1 03:40.38 3     2/1  30    3820K  0B     0B   303  1
237  WindowServer 19.0 18:17.49 11    4    1862+ 340M   22M-   0B   237  1
682  Terminal     11.9 00:13.53 8/1   1    305-  29M-   5944K+ 0B   682  1
501  Activity Mon 9.6  21:51.42 5/2   3    1392+ 85M+   10M    0B   501  1
153  hidd         9.1  03:23.60 6     3    221   4476K- 0B     0B   153  1
819  top          8.0  00:01.29 1/1   0    28    3752K+ 0B     0B   819  684
0    kernel_task  6.3  04:49.91 171/8 0    0     66M    0B     0B   0    0
111  powerd       2.0  00:42.87 3     2    116   2592K  0B     0B   111  1

