7

How is the per-process "Memory" column calculated in Activity Monitor? The name is quite vague and I haven't found anyone say anything about it aside from stuff like, e.g., "Memory used in RAM." I can't quite tell the relation between it and real memory, shared memory, private memory, dirty memory, etc.

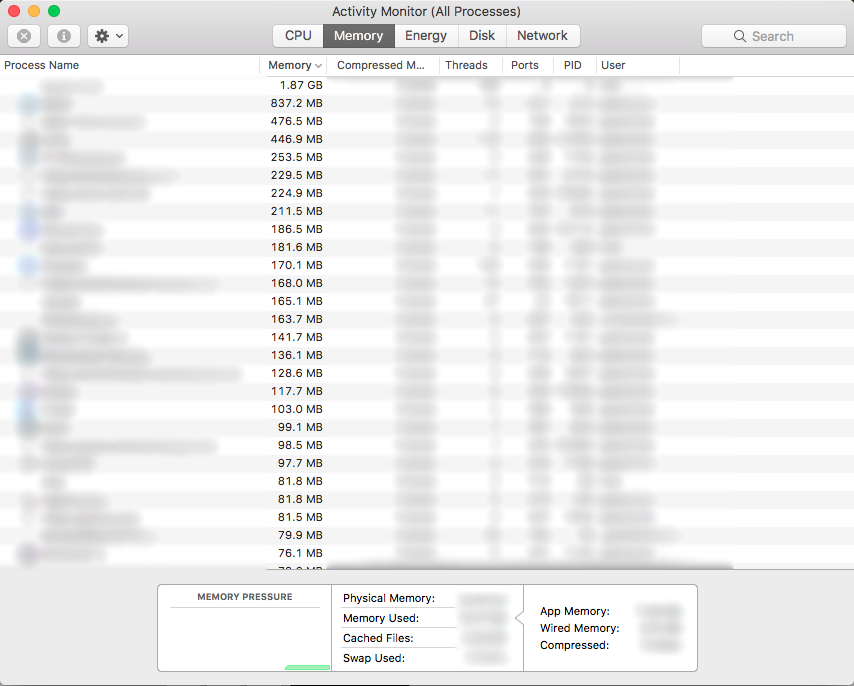
FYI, I'm talking about this column:

Memory column

1
  • Only Apple knows Commented May 26, 2017 at 15:46

2 Answers 2

4

The Memory column is overall memory consumption, excluding compression, etc. going on. The Compressed Mem column is how much memory is being saved by the operating system's memory compression algorithm. The Real Mem column essentially shows Memory - Compressed Mem to give you an idea of how much actual memory is being consumed by the process. Private Mem shows you how much memory is being consumed by this particular process that is not being shared by any other processes and of course then Shared Mem would be what's being shared with other processes.

As far as actually tracking the memory consumption itself, I would have to dig a bit more into the developer documentation as I don't know off the top of my head how Xnu/Darwin tracks memory consumption on a per process basis to actually report such figures.

Please let me know if you're looking for any additional details or clarification as your previous question is slightly vague with regards to whether you're seeking specific acquisition details or just what the columns mean...

5
  • So, to be clear, I'm just interested in understanding what that column means / how those numbers in it are obtained. I already grok Private Mem, Shared Mem, Compressed Mem et al. Yet, I don't grok exactly what Memory represents since it is obviously distinct from Real Mem, which is supposed to be the de facto memory consumption of a process, according to my understanding. Could you be more specific as to what makes it distinct from Real Mem than simply: "The Memory column is overall memory consumption, excluding compression, etc. going on." ?
    – GDP2
    Commented May 24, 2017 at 5:25
  • 3
    Also, this point: "The Real Mem column essentially shows Memory - Compressed Mem" seems untrue since my Compressed Mem is almost always at 0, yet the Real Mem is always higher than Memory.
    – GDP2
    Commented May 24, 2017 at 5:25
  • After looking into this more recently with a somewhat better understanding of how memory really works, I see that you are right @ylluminate. It certainly is required to dig into XNU in order to understand exactly how these values are being calculated. So I'll go ahead and accept your answer since it's better than anything I've seen otherwise.
    – GDP2
    Commented Nov 2, 2017 at 6:05
  • I can't make any sense of what shows in Mojave Activity Monitor, considering the above discussion. E.g., this line is apple.stackexchange.com, presumably the process viewing this page ("Compressed Mem 0 bytes" simplifies this case!). Ideas? "Real Mem 149.8 MB -- Shared Memory 28.2 MB -- Private Mem 85.2 MB -- Memory 87.2 MB -- Compressed Memory 0 bytes"
    – vonlost
    Commented Feb 8, 2019 at 20:47
  • @vonlost are you still seeing 0 on the compressed memory column? If so, you should submit a bug report to Apple (bugreport.apple.com). They indicated to me before that this is a bug and need a sysdiagnose to research further... It's now fixed for me in a recent beta update.
    – ylluminate
    Commented Feb 25, 2019 at 17:15
0

The column appears to correspond to phys_footprint, which you can get from passing TASK_VM_INFO to task_info. This metric seems to also be used in other places in the system such as Xcode’s memory statistics, and other internal bookkeeping elsewhere.

You must log in to answer this question.

Not the answer you're looking for? Browse other questions tagged .