7

Sometimes my Macbook grinds to a halt due to the GPU's onboard memory getting full. (I know this because the CPU use, RAM use and disk use are all low, and because closing things like Chrome tabs and large pdfs tends to resolve the issue.) To avoid this, I'd like to be able to monitor the use of my system's graphics memory.

There doesn't seem to be an option in Activity Monitor, but is there some other way I can tell (a) how much graphics memory is currently free, and if possible (b) which apps are currently using the greatest amount of it?

I'd much prefer a free solution over a paid one; a Terminal-based solution would be fine.

5
  • Can you post a screen shot of activity monitor's memory tab when the system has ground to a halt?
    – samh
    Commented Sep 4, 2014 at 13:47
  • @samh ok, I'll do that next time it happens.
    – N. Virgo
    Commented Sep 5, 2014 at 1:04
  • My Mac Pro's Radeon 5770's memory is pretty well pinned on Yosemite. If I close everything, it's still 50% full. Not sure what the deal with, my secondary card's memory is untouched. I've also noticed that scroll-zoom on Yosemite works horribly for my Mac Pro. I submitted a couple bug reports on that during the Yosemite beta, but I guess they decided it wasn't a real problem :( Commented Dec 21, 2014 at 8:49
  • @Doc what are you using to measure your GPU memory use?
    – N. Virgo
    Commented Dec 21, 2014 at 9:32
  • @Nathaniel I'm using iStat Menus Commented Dec 22, 2014 at 5:34

2 Answers 2

4
+25

I am not saying you are wrong, but the GPU memory is normally used for rendering the current laptop 2D display, and then for the calculations for 3D display (games), and GPU acceleration (modern browsers). I've used, programmed various computers for many years, and yet to see an issue related to an application using to much GPU memory.

But ISTRC MBP from 2010 onwards(?) have two GPU's the integrated (intel) and the discrete (NVIDIA GeForce 320M in mine). The MBP has good battery life due to when rendering text, images for the screen the low energy intel is used, but when game, videos are played and need more GPU processing is required the NVIDIA graphics chip is used. Maybe you have an issue with the NVIDIA graphics?

It's maybe more likely that it could be a 'wait' caused by an issue with the filesystem, hard drive, or maybe elsewhere. A failing hard drive will not report loads of activity when accessing a file that the hard drive controller takes extra long to read from.

It may help people to help you if you say how often it happens, whether the spinning beach ball appears, if it's a case of just taking a few moments to close windows, and then it wakes up again quickly or slowly?

Next time it happens try closing one application set of windows, say Chrome, and then wait (5 minutes) to see if that fixes it, and then the next try the other. As it's likely to be only one application that is the main issue, and you'll do best in trying to narrow it down.

I've MacBook that getting a little slow occasionally but it's not gotten to the point where I need to correct it.

Good Luck!

5
  • Thanks for the help. To answer your queries, the beachball rarely appears, the Mac just gets unresponsive - I start getting delays between typing and seeing the characters appear, for example. I typically have a lot of windows open (fifty at least) in various apps, none of them using much resources individually. Closing the right kind of thing helps instantly; the best ones are (a) a Google Chrome window with 10+ tabs, (b) a large pdf, or (c) Keynote or iTunes. The HD is solid state. Does any of that help narrow it down?
    – N. Virgo
    Commented Sep 4, 2014 at 12:28
  • Ah. Maybe the solid state info will help someone with a suggestion. I guess you have a good spec 15" MBP that normally really fast until it hits this wall. Some retina MBP are being recalled for graphics issues. You should be able to check on an apple page your serial number to check if your laptop is covered by the recall. Commented Sep 4, 2014 at 12:40
  • Yeah, that's basically it - it's super-zippy, so I just keep leaving stuff open until it suddenly slows right down. I thought the GPU memory must be the bottleneck, but I guess it could be something else.
    – N. Virgo
    Commented Sep 4, 2014 at 12:46
  • 1
    If you have that many windows open, the culprit is much more likely to be system RAM than GPU RAM. GPU RAM is not used like system memory and doesn't get full in the same way.
    – samh
    Commented Sep 4, 2014 at 13:47
  • @samh according to Activity Monitor, there's usually around half of the system RAM free. (I usually get rid of things if they're using up RAM or CPU time, so I end up with lots of things like text documents and Chrome tabs managed by the Great Suspender plugin, which don't take up much of anything.)
    – N. Virgo
    Commented Sep 5, 2014 at 1:03
1

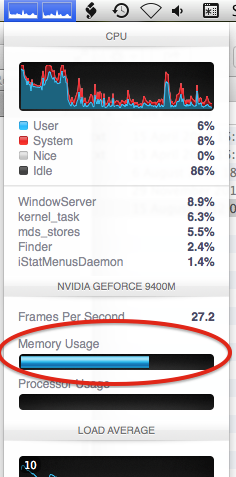
I'm using iStat Menus, which shows a GPU Memory Usage figure.

The screenshot below is from my copy of iStat Menus 4.22. There is a new version 5 release, which includes "better per-app stats". I haven't tried this: I suspect it doesn't break down the GPU figures per-app, but it's worth a try -- there is a free trial.

iStat Menus 4.22 CPU & GPU menu

3
  • Neither does iStat Menus 5
    – grg
    Commented Sep 8, 2014 at 18:55
  • Looks familiar. Here's what mine looks like: s3.amazonaws.com/slash_b/… My system is fairly idle and yet my main video card is getting rocked. NSA cracking-worm? Commented Dec 21, 2014 at 8:54
  • How could I know which process is using GPU?
    – nn0p
    Commented Aug 9, 2017 at 13:16

You must log in to answer this question.

Not the answer you're looking for? Browse other questions tagged .