0

My Macbook M1 is experiencing severe performance issues at times, but I have hard time finding any hard data that shows what the issue is. htop shows lots of free memory and cpu, yet it seems as if the machine is thrashing extensively (stuttering, programs freezing for multiple seconds unresponsive, etc) under load. Where can I look to know what the issue is?

I am a developer and use Docker, IntelliJ and Node (webpack create-react-app watch task running, consuming 10-30% cpu constantly) a lot. These usually can consume a lot of resources, but when I look at htop I see that only about 3GB of 8GB RAM is consumed. That should indicate that I am not running out of memory, right?

Still, it seems as if I am being tricked by these stats: my work desktop computer has 64GB of RAM and an i9 CPU (on paper weaker than the M1), but has no such issues under similar conditions (same project, same programs running, etc.) To me, this indicates that memory is the issue, but I want to see some data supporting this. Where do I look?

The fact that I get multi-second stalls and switching between IntelliJ and Terminal could take a few seconds gives me the impression that we are talking about memory-paging to disk being a factor. htop does show between 6 and 8 GB being swapped to disk. Modern OS-es do cache a lot of stuff, so this is not that surprising, still, I am wondering why I am not using most of my RAM, if this really is the case?

I mentioned IntelliJ, but this also affects using Chrome and iTerm. Quitting Docker (and the associated processes) seems to lighten the perceived load a bit and the amount of memory swapped out usually goes down by 1 GB or so, which again seems to point to memory.

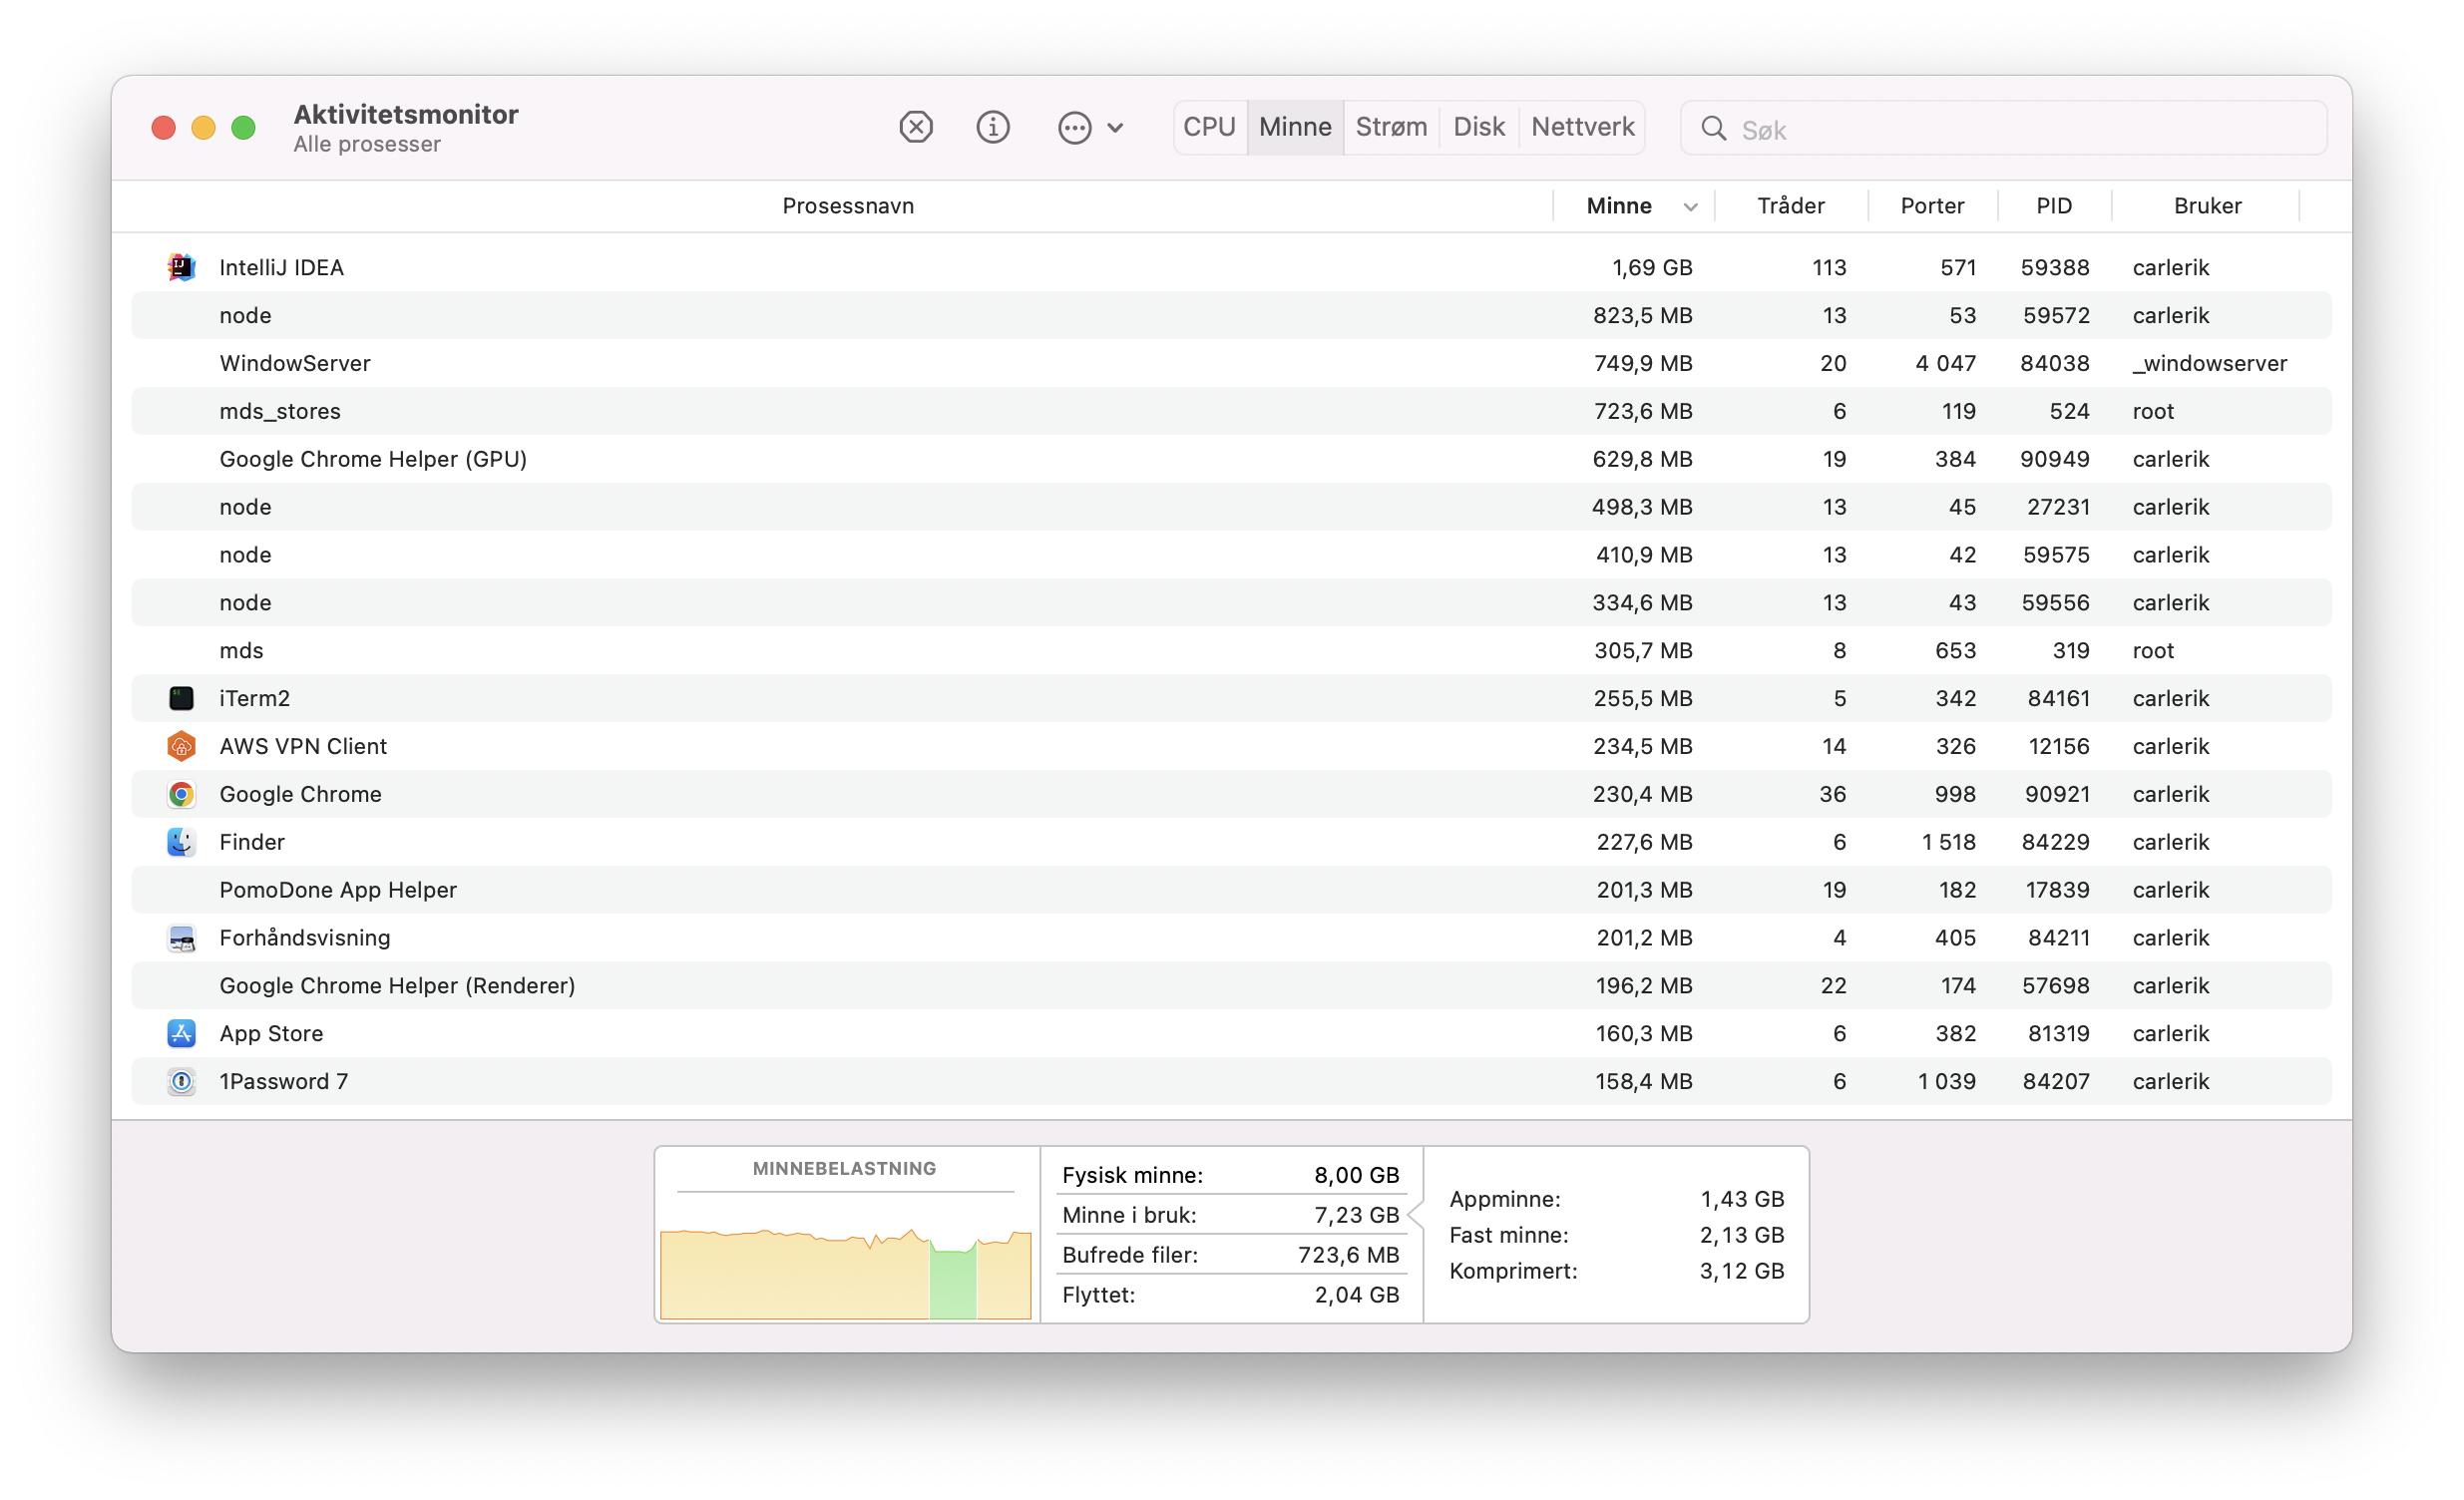
memory load in the red


Hardware: Macbook 2020 with Apple M1, 256GB, 8GB RAM.

4
  • 2
    Don't use htop. Look at Activity Monitor app, and see under the Memory tab what the Memory pressure is.
    – benwiggy
    Commented Apr 19, 2022 at 11:34
  • 1
    Could you include screenshots of htop or Activity Monitor? - I have the feeling that you're probably lacking memory, but interpreting the output from htop incorrectly.
    – jksoegaard
    Commented Apr 19, 2022 at 12:09
  • Will add some screenshots when I get back home. Thanks!
    – oligofren
    Commented Apr 19, 2022 at 14:23
  • 1
    A developer machine intended to run Docker, IntelliJ and Node well needs more memory than 8GB unless you do some heavy handtuning. Developers needs as much memory as they or their employer can afford. Commented Apr 23, 2022 at 8:40

2 Answers 2

2

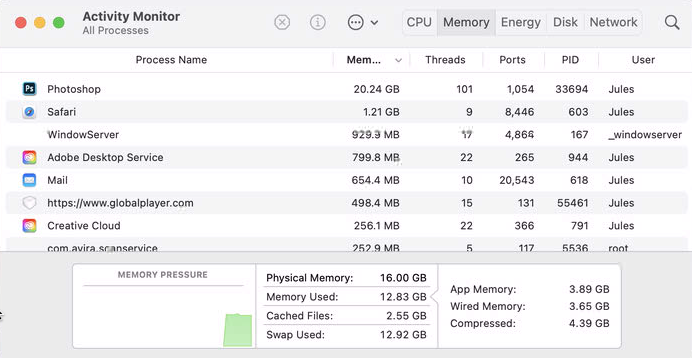
I'd guess the difference is going to be the RAM, causing it to swap a lot. I see the same on a 16GB M1 iMac, but not on a 10-year-older 64GB Mac Pro.

enter image description here

enter image description here

Both Macs have about a month uptime since last reboot. Photoshop is obviously taking a good share on each, yet as each is at present, it causes no swap issues. The iMac though has one large task which isn't running at the moment. When that weighs in too, it starts to get bogged down. Even switching over to Safari you can see it needs about 5 seconds to fully activate the current page.
I'm actually mildly surprised the Mac Pro at the bottom is showing any swap at all. It very rarely does.
Personally, I don't think 16GB is enough these days.
BTW, I've long since given up trying to match these numbers with htop & the like. I tend to just rely on Memory Used, Swap & the graph on the left. You can soon tell when it's struggling using just those three.

1

I thought I would add some information on looking into these numbers myself, just to add some information. Although I found some nice tools with numbers (vmmap) in another thread, the basic conclusion for this issue is the same as Tetsuin:

I've long since given up trying to match these numbers with htop & the like.

Inspecting the numbers for memory in use, swap and others before and after loading some big-ass programs (4GB just to Docker) hardly showed any difference. The graph did move up a notch, though, and is prolly the best bet: if seeing the bar have hints of red in it, memory pressure is severe and the swapping will make a huge difference to the perceived performance.

This is the memory after killing a bunch of programs, then starting Node (the first bump into yellow), then starting IntelliJ (the second bump, this time memory constrained to 1500MB). Memory pressure in green after killing programs

The performance is great (no swapping causing stuttering and freezes), so trying actively to avoid swapping seems like a good bet :p Obviously, Docker seems like to big of a beast to be running on this machine, consuming 4GB or so (according to the Activity Monitor) and limiting the heap memory of IntelliJ also seemed to help: IntelliJ heap settings

This was set to use up to 5500 MB and it obviously caused issues. 1500 MB seems like a happy compromise on this machine.

5
  • Adding information should be done by editing the question or commenting on it. The answer form, unsurprisingly, is intended for answering the question.
    – WGroleau
    Commented Apr 23, 2022 at 6:55
  • 1
    I know, and I did add the additional information to the question. This answer was adding answer information, not question information. I just added further tips and relevant info for others on the search. This answers my question so belongs in the answer section.
    – oligofren
    Commented Apr 23, 2022 at 7:08
  • 1
    Also IntellJ has a power save mode, which might help here. Commented Apr 23, 2022 at 8:38
  • Nice bit of solid research, after my general 'hand-waving' answer to set you off in the right direction. I did think it was going to be swap that would be the bottleneck. Glad to see you can confirm it.
    – Tetsujin
    Commented Apr 23, 2022 at 8:41
  • 1
    The answer to the question "How can I see..." is "Use Activity Monitor". The answer to "Is my Mac's 8Gb of memory constrained using dev tools" is "Yes". ;-)
    – benwiggy
    Commented Apr 23, 2022 at 10:51

You must log in to answer this question.

Not the answer you're looking for? Browse other questions tagged .